Firefox DevTools WebConsole 2018 retrospective
In 2017, we rewrote and shipped the WebConsole using React. But our work wasn’t done, it was only the stepping stone for where we wanted the WebConsole to be: close the gap with Chrome and ship unique features that would make users more productive.
So join me for a tour of what happened in the console in 2018, and what to expect in 2019.
Winter
As said in the intro, we rewrote and shipped the new WebConsole by the end of 2017. But there was still a place where the old code was used: the Browser Console.
The Browser Console gathers all the messages spawned by the different tabs of a Firefox instance, WebExtension logs and messages from Firefox code itself (what’s called Chrome, i.e. everything that is not content page, not to be confused with the Chrome browser).
As you can imagine, this involves more work than only showing messages from one given place, which is why it didn’t land at the same time as the “simple” WebConsole.
The old WebConsole had a hecka lot of tests that we couldn’t simply dismiss. In 2017, we started a journey to evaluate and then remove or migrate all the existing tests in the codebase. This tasks continued in the beginning of 2018 for all the Browser Console tests and was DONE by the end of Winter, with the help of a lot of people from the DevTools team. Success!
With all the test migrated, and the Browser Console using the new code, we can now create the most satisfying patch: delete the whole old WebConsole codebase. Farewell!
Spring
Logan Smyth, from the debugger team, made it so the console uses the information provided by sourcemaps to rewrite evaluated expressions on the fly so they are still properly evaluated by the Javascript engine. Let’s look at an example.
Say you have a hello variable, but your build/minification step renames it to a, you can now still do console.log(hello) and see the value of hello, even if, from a browser perspective, hello does not exist. Under the hood, we transform the expression to console.log(a) so you’re still getting what you need.
Around the same time, J. Ryan Stinnett is working on emitting CSS warnings only if the user has the CSS filter enabled. Those warnings can be very verbose and could affect the performance of our tools, so it made a lot of sense to only report them if the user wanted them.
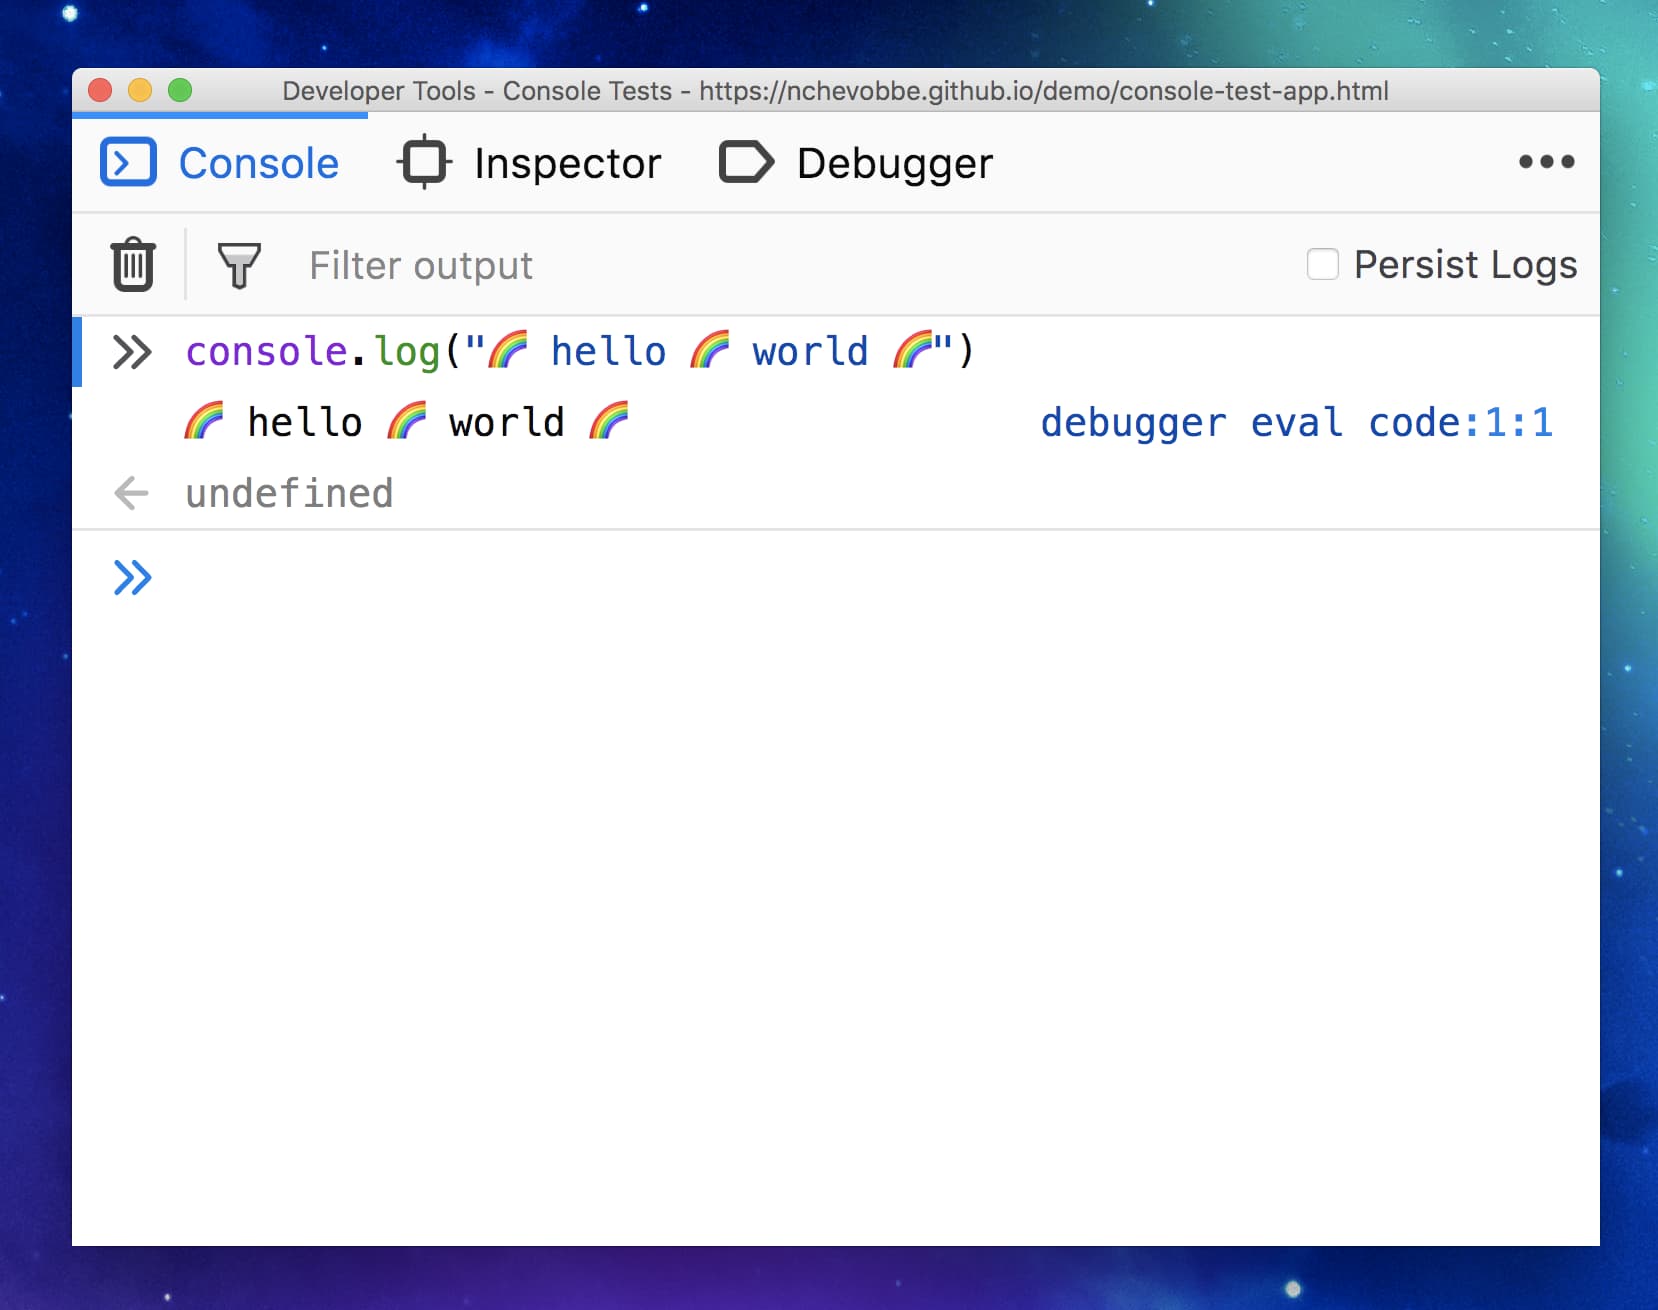
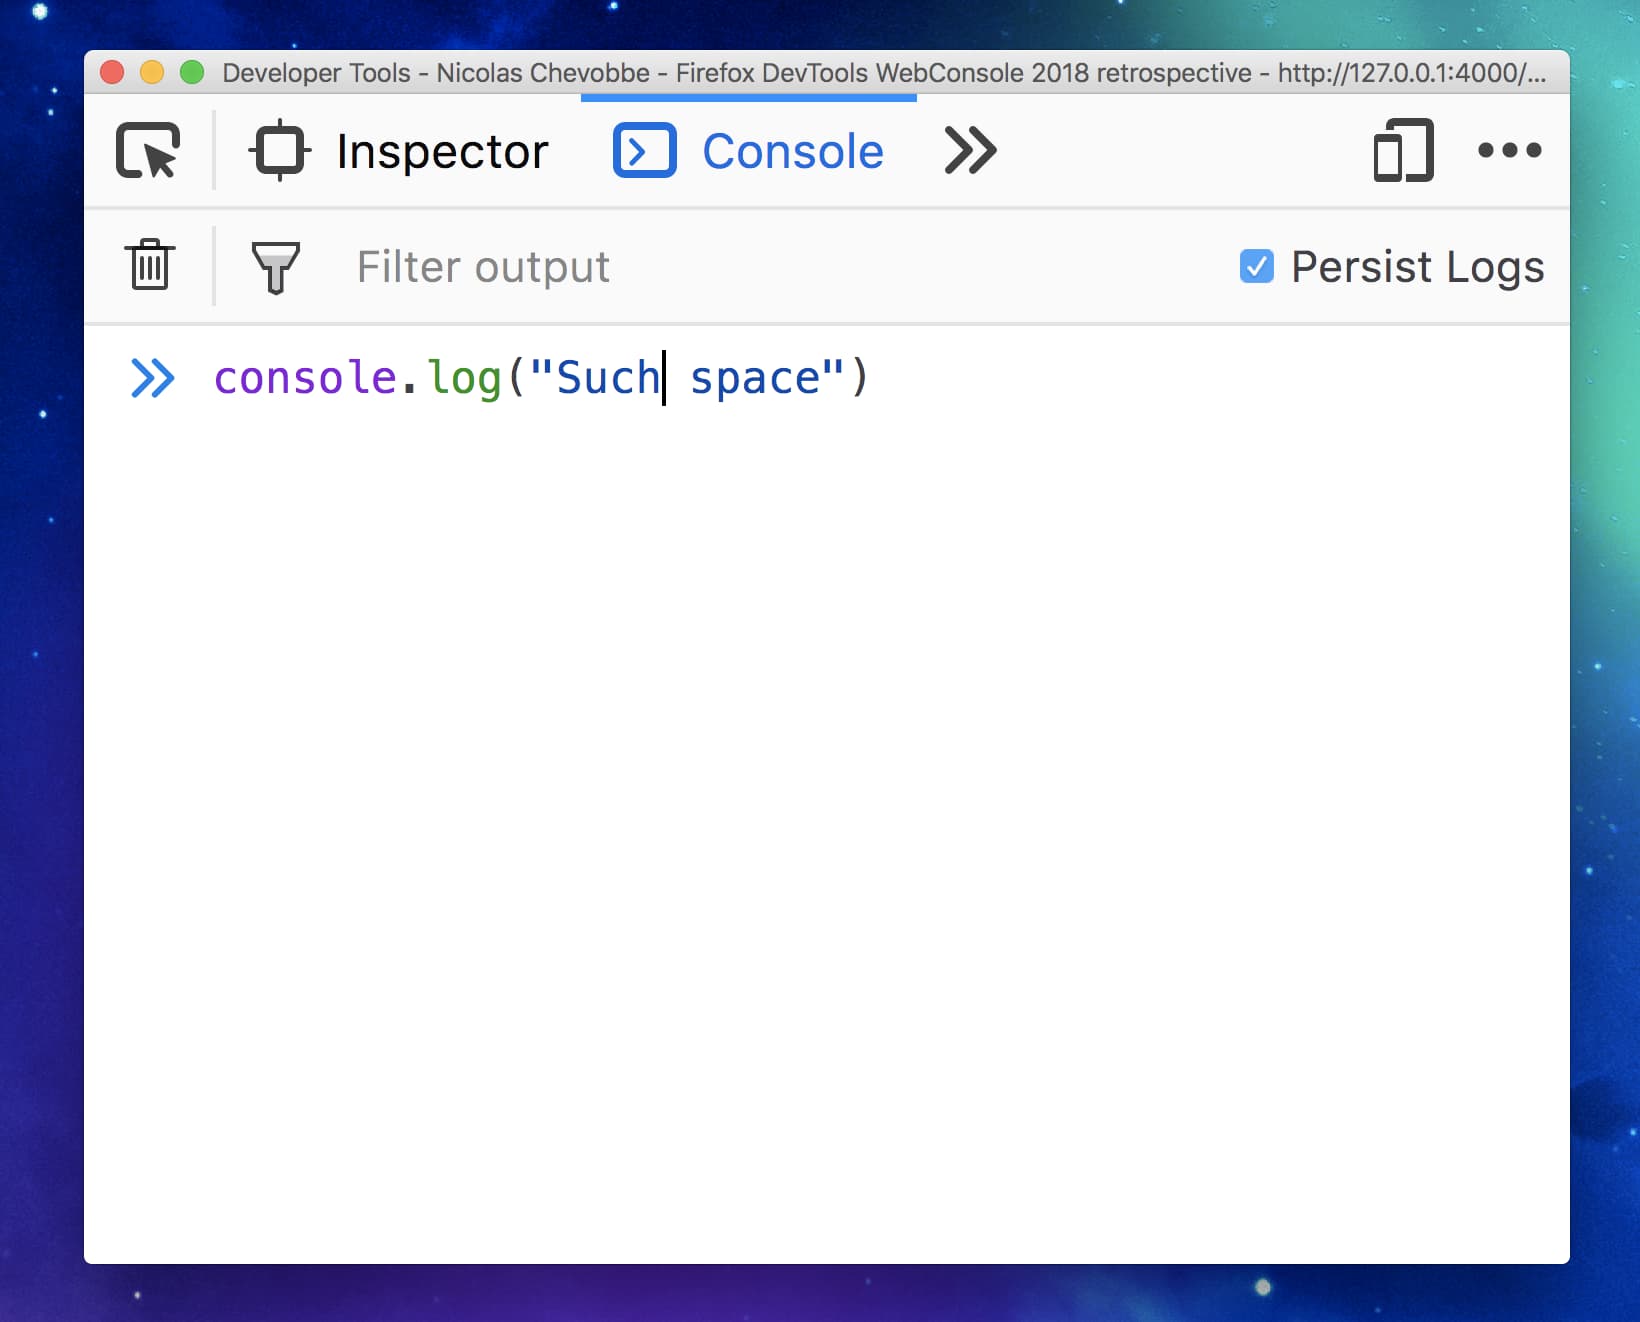
Late May, we roll-out one of our most visible changes: the console input now has syntax highlighting, using a CodeMirror instance under the hood.
Doing this also required quite some refactoring through the summer, as most of our codebase assumed we were working with a simple HTML <textarea>, where we now have to integrate with CodeMirror APIs.
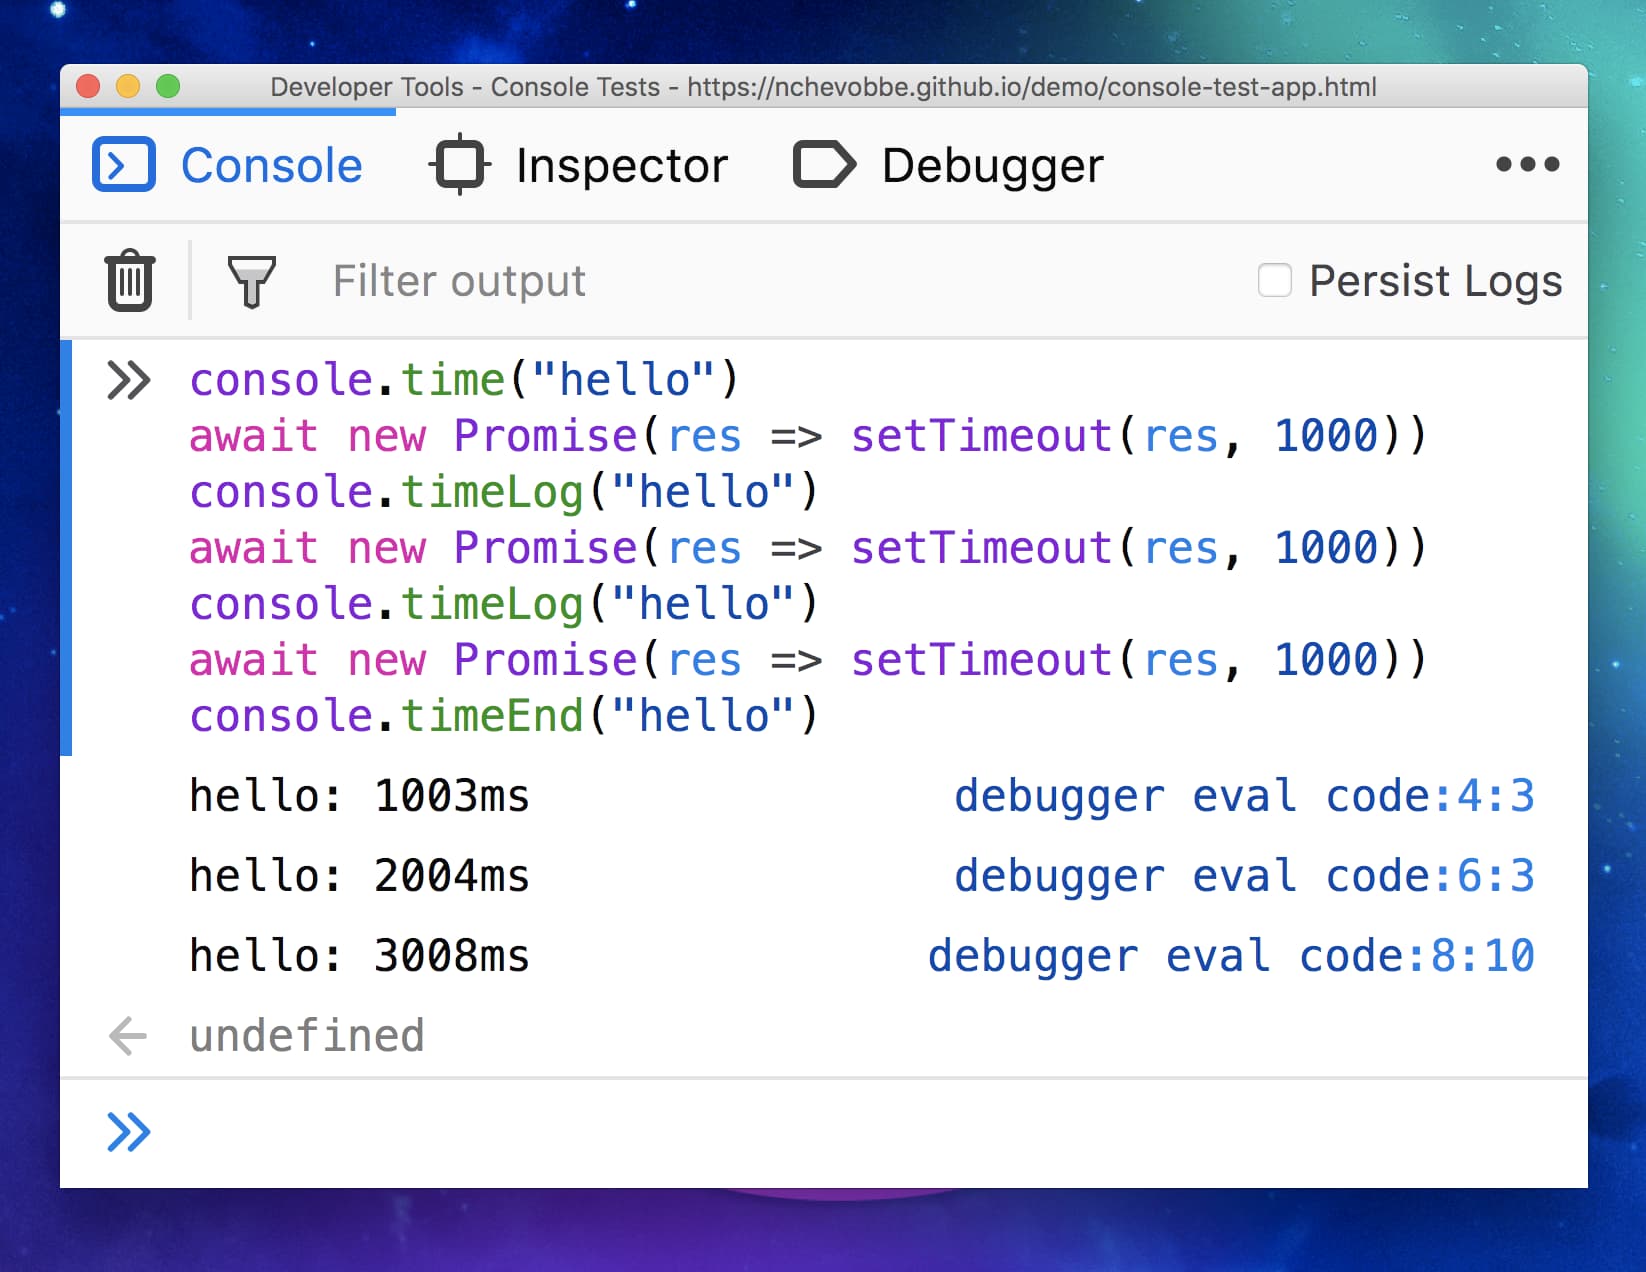
On a smaller note, console.timeLog is specced and implemented in Firefox. It allows users to print intermediate measures for a given timer.
console.time("hello");
console.timeLog("hello", "1st measure");
console.timeLog("hello", "2nd measure");
console.timeEnd("hello", "final measure");
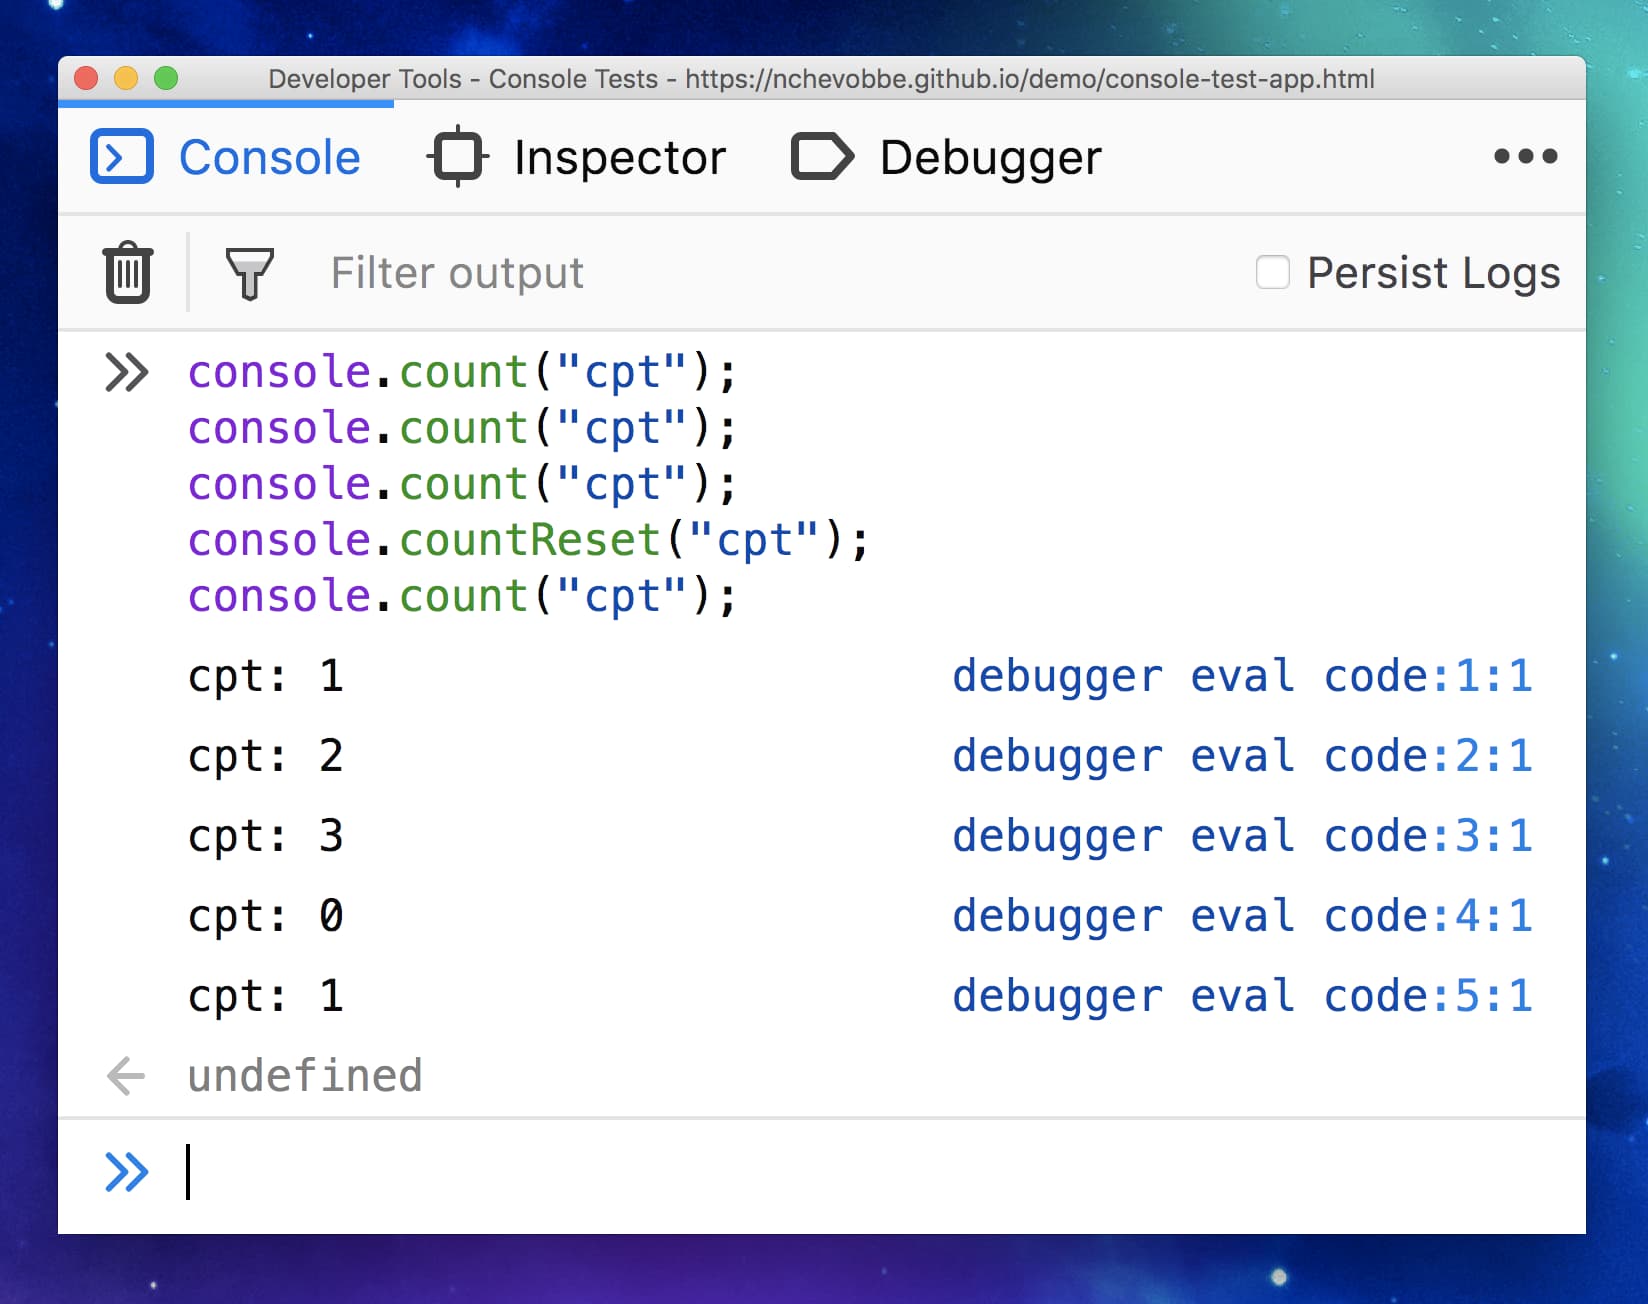
Another console API is also implemented, console.countReset (See the spec). As stated by its name, using it resets a given counter created with console.count.
console.count("cpt"); // cpt: 1
console.count("cpt"); // cpt: 2
console.count("cpt"); // cpt: 3
console.countReset("cpt"); // Resets the "cpt" counter
console.count("cpt"); // cpt: 1
Finally, we add one more interaction with the Debugger. When logging a function, an icon is displayed after it so you can jump to its definition and check out its content.
Summer
The DevTools team wants to remove GCLI, which is not widely used and relies on old technologies that will be removed from Firefox in the future (XUL). The GCLI exposed commands that user could run, the most popular one being the screenshot command. It let you grab a part, or the full view, of a website and save it to an image file on your disk.
As we did want to keep this feature for users who need it, we decided to migrate it in the console.
Yulia Startsev did most of the work here to deliver a :screenshot command, which you can read about in this nice article by Eric Meyer.
This was a good opportunity to define what commands could look like in the WebConsole, and how to differentiate them from Javascript expression (hence the : at the beginning of those). We used it to create a second command, :help (previously existing as a JS help() function), that redirects the user to an MDN page listing all the existing helpers in the console.
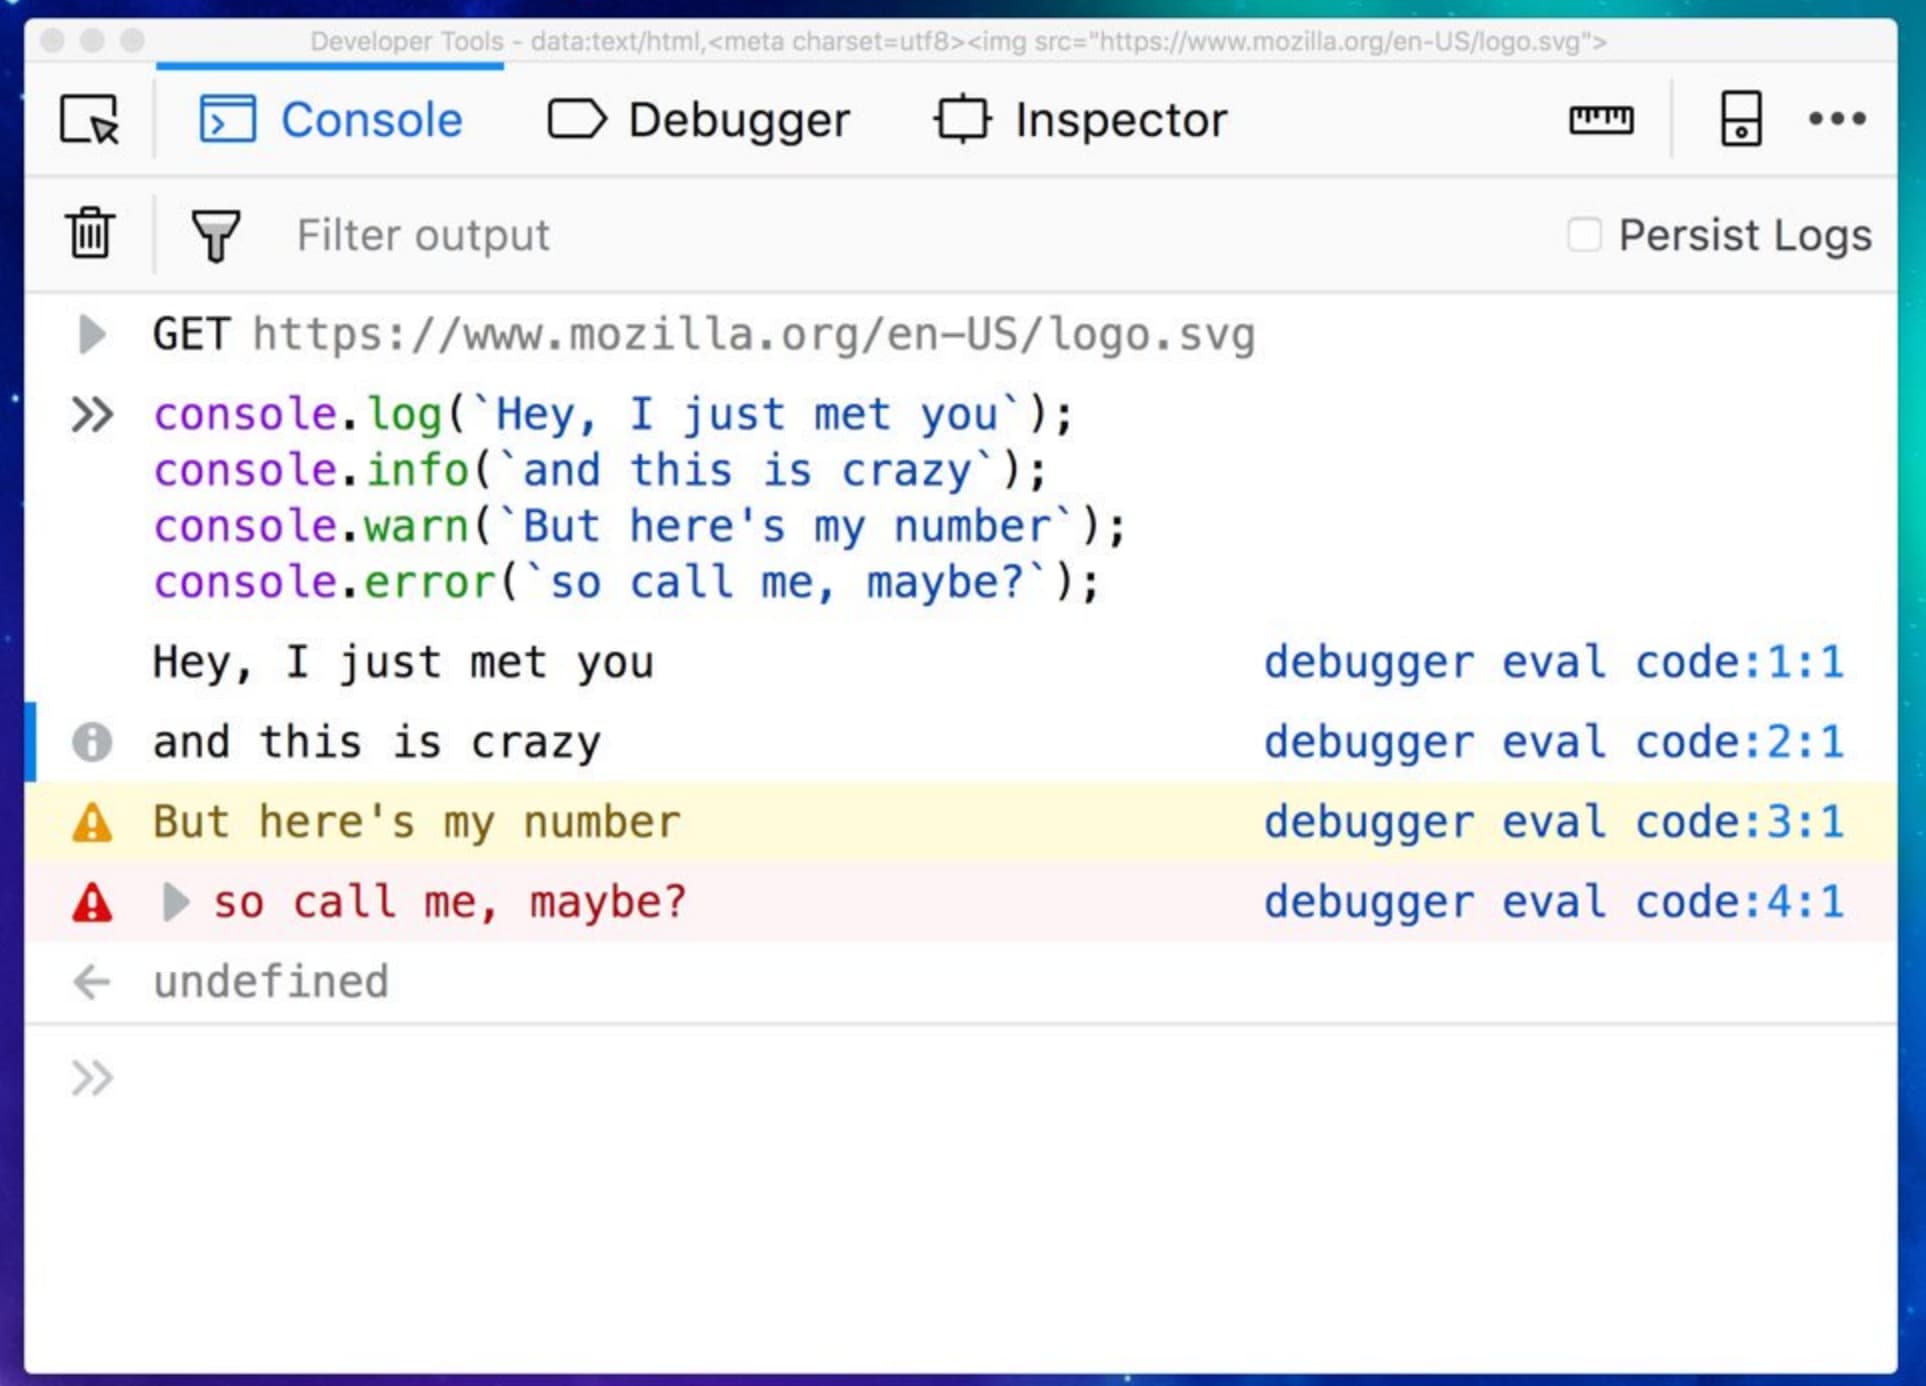
As a follow-up of our syntax highlighting work, Brian Grinstead lands a patch to add it to the expression when displayed in the output.
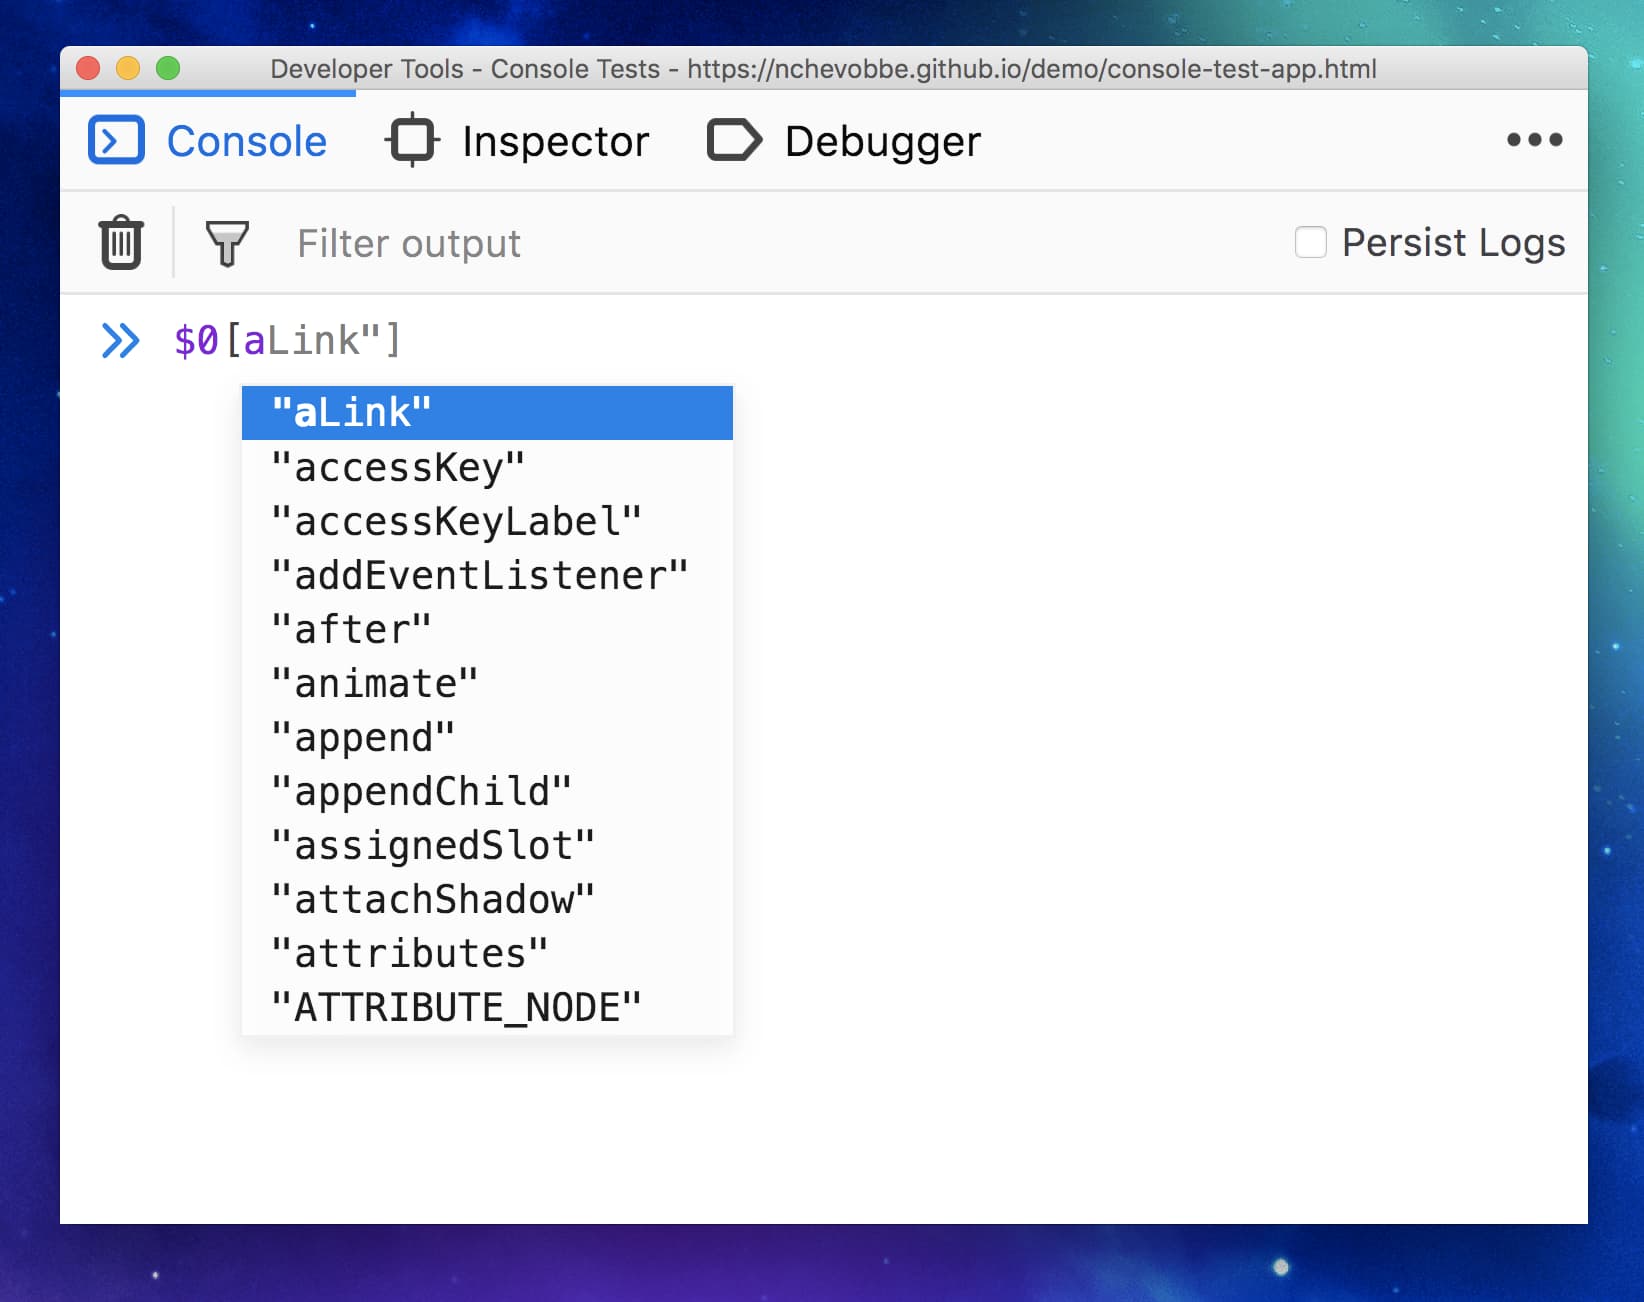
As we’re revamping the console input experience, it makes sense to work on an essential feature of any code editor, the Autocomplete popup. We had a wide range of issues with it and tried our best to fix them all in order to make it less confusing:
- We aligned its style with the rest of the UI, using the Photon design system.
- We tried to make it as fast as possible
- We don’t reverse the items anymore.
- It’s case insensitive.
- It can be triggered with [.
- User can force a completion using Ctrl+Space.
- There is better heuristics for when to display it or not.
- It displays javascript keywords (i.e.
var,function,for, …). - It now works with
$_and$0.
Last year Florens started doing awesome contributions to the whole DevTools codebase, with no exception to the console. They identified some visual flaws, misalignments and less-than-ideal colors in the output, and came up with wonderful fixes for all those.
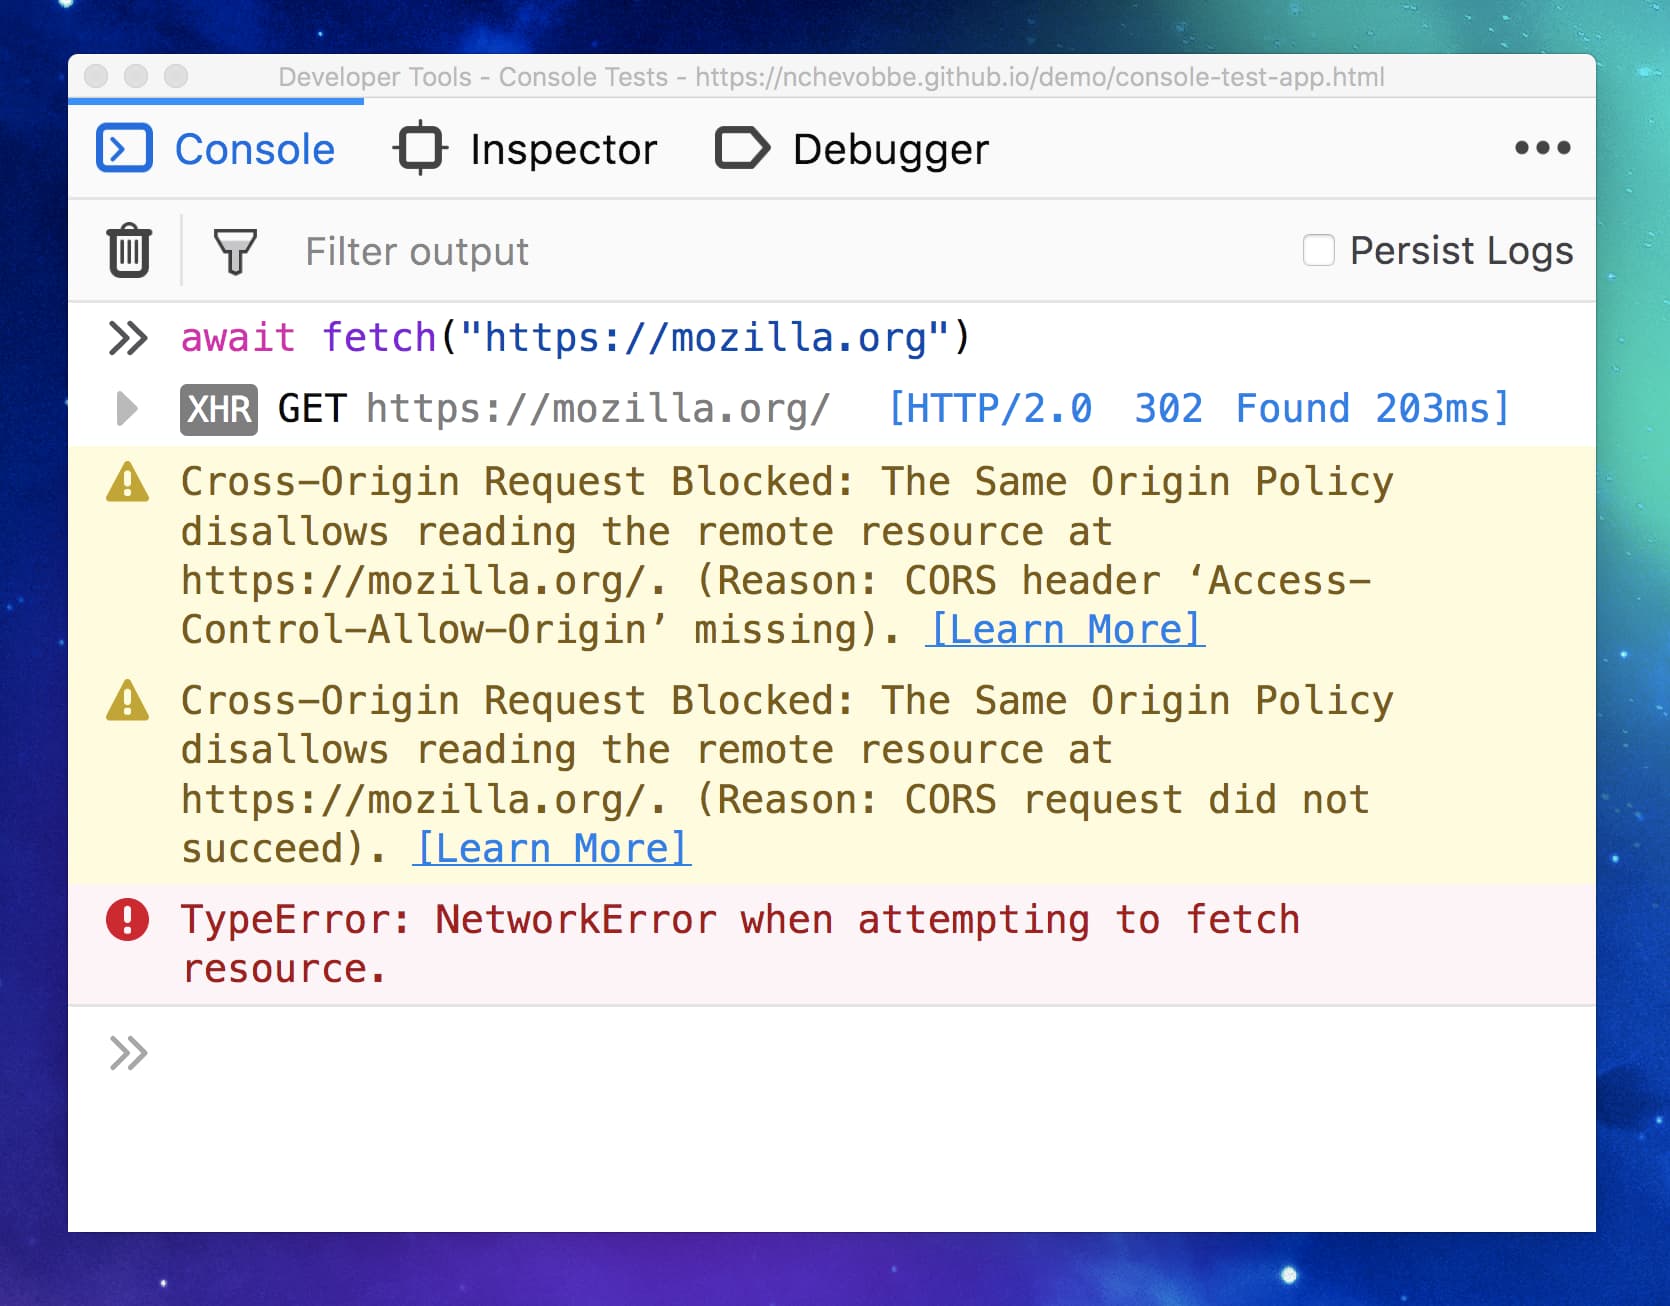
CORS is hard, and errors are legion. We rephrased some CORS error messages and added Learn More links next to them that point to MDN pages where you can get your head around what’s going on.
Autumn
Well rested from our Summer holidays, we can now go full-steam ahead.
One of the biggest complain we had about the Console was that its input was small and at the very bottom of the screen, even if the output was empty.
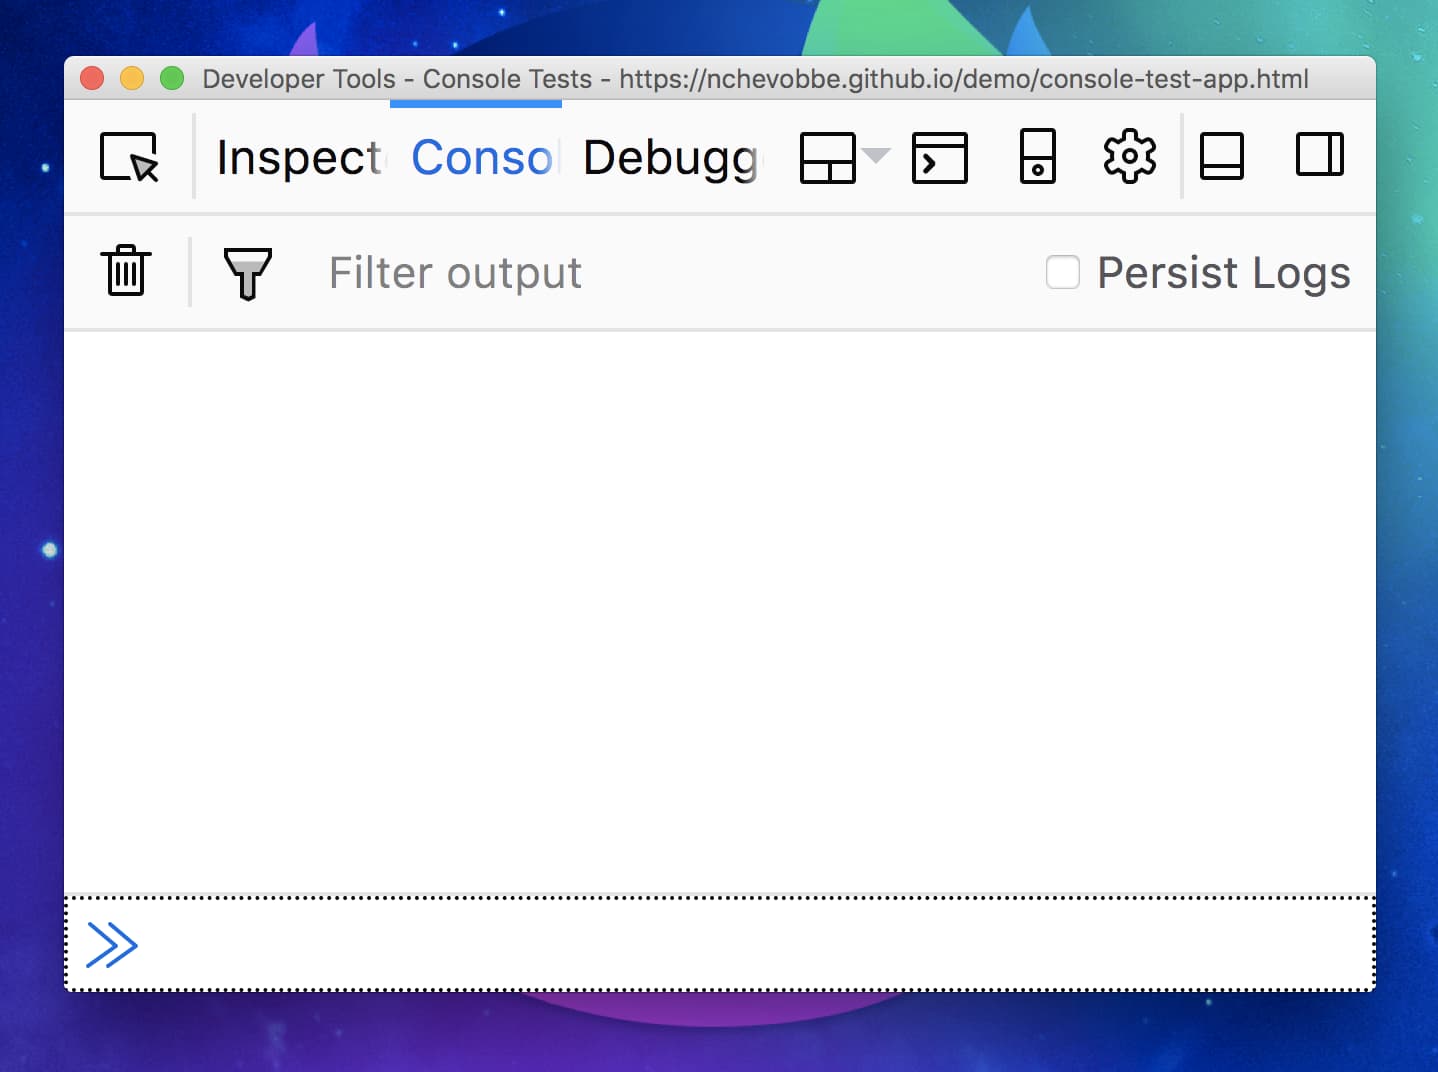
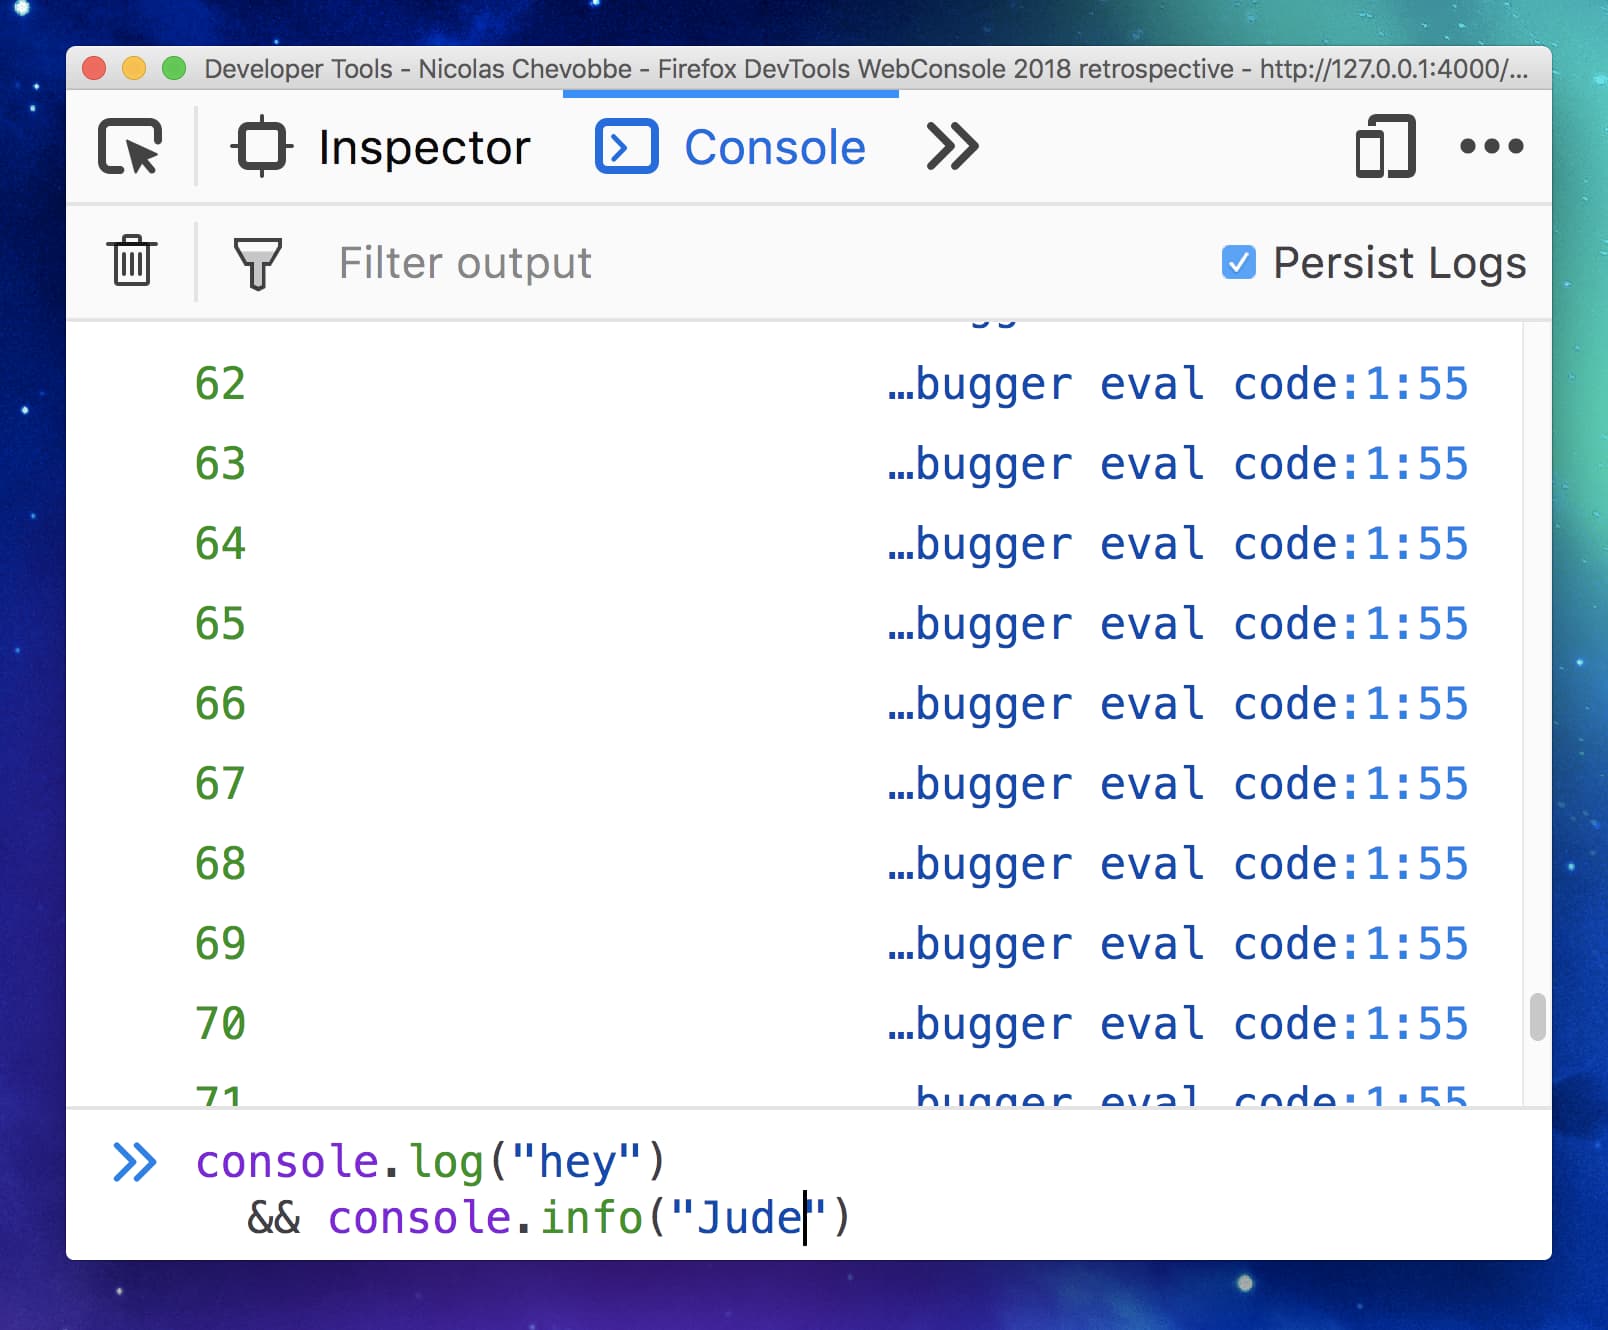
Sure it was always focused, and entering multiline expressions would make it grow, but maybe it wasn’t obvious and made people angrily clicking this tiny target. To address that, we implemented a terminal-like UI, where the input takes as much height as it can, and shrinks as the output gets filled-in.
We didn’t want to go all the way into Chrome direction though. There, the console input is alway after all the messages, meaning that if you scroll up, you can’t see it anymore (even though it’s still focused and a keystroke will get you back to it). Our design make it so the input is always visible, so even if you scrolled way back up to look for an object, the input is always at sight for you to interact with it.
Since we were going terminal-like, we thought why not implementing one of the most useful feature a terminal can offer: reverse history search. So you can now do F9 or (Ctrl+R on OSX) to display a search field that will look into your commands history. Retrieving that so-cool 1-month-old snippet is now blazingly fast.
Finding a good shortcut to trigger the UI was surprisingly hard. Since we wanted the browser shortcuts to still work (e.g. on Windows, Ctrl+R reloads the page), we had to look for leftovers, which left us with F9. We’re working on putting a button in the UI to toggle it so it’s more discoverable than it is today.
Closing the gap with Chrome DevTools meant implementing top-level await expression support. At the moment, await expression are only valid in async functions and generators (even if there’s a tc39 proposal to change that). So we had to be creative in order to support it in the console. Jason Laster kick-off and lands a first version, that then motivated me in pushing it over the finish line.
It’s a great feature to have in order to quickly prototype in the console.
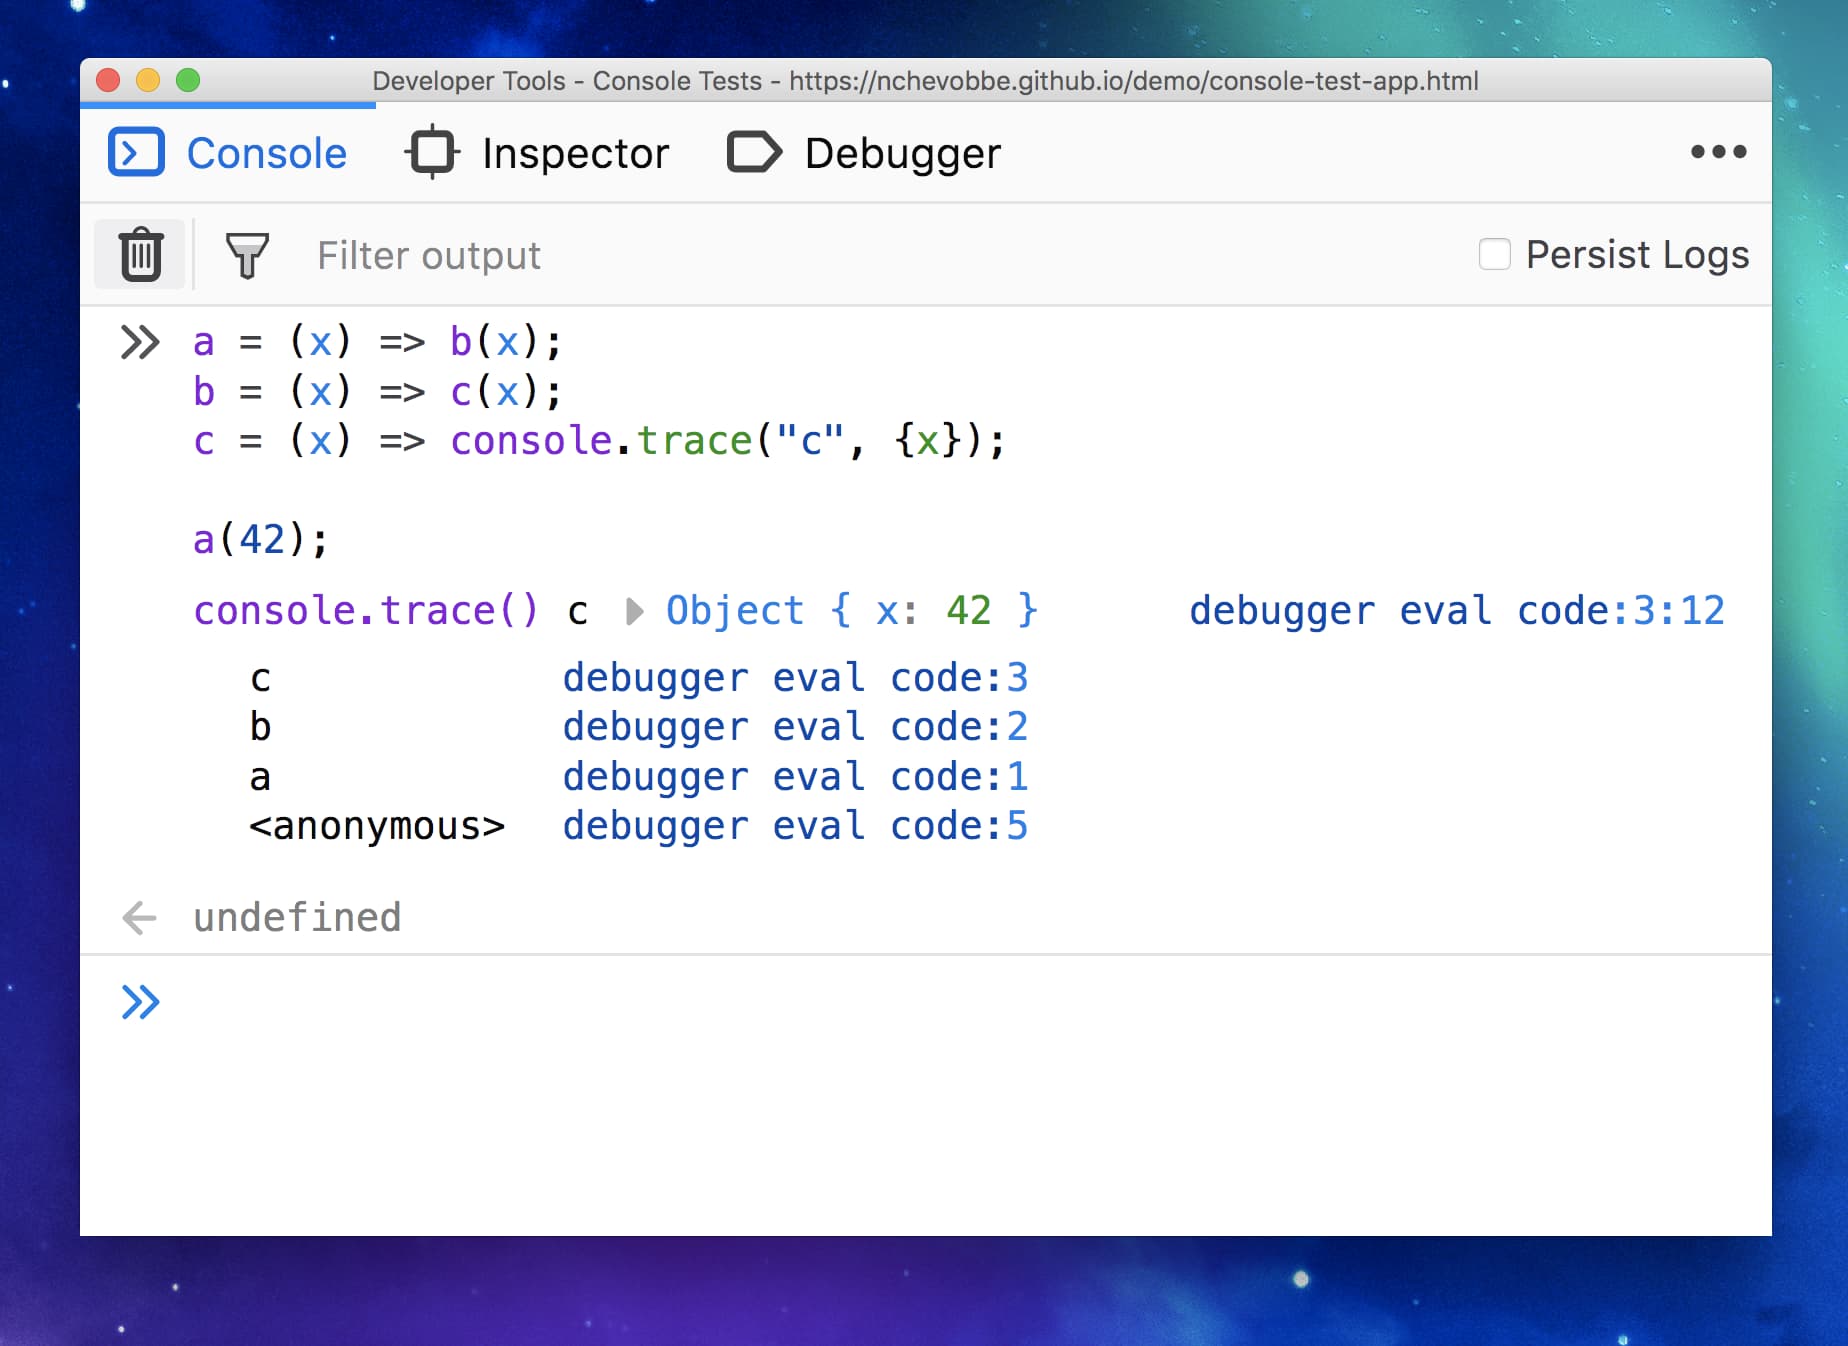
console.trace is super useful when you need to know from where a given function was called. But it could be a bit hard to tell at a first glance from where the stacktrace printed on your screen came from. Also, you may need additional information like the value of the parameters or variables, which previously required people to simply drop an additional console.log to get those. console.trace now takes multiple arguments, so you can save the superfluous console.log.
In Spring, we had a work week in Paris with Jason Laster and Patrick Brosset, and one of the main themes was to evaluate what it would take for the console to re-use the awesome callstack component used in the Debugger. The Debugger community built this callstack where all successive framework/library frames are grouped, and collapsed, so the user has a shorter stack trace to look at, highlighting the app code, not the framework one.
As always, the initial implementation is easy, but the devil’s in the detail, and there were many things to think about, mainly because the design of the debugger call stack panel, and what we wanted the console stack trace to look like are quite different. Also, this stacktrace component should be used everywhere we possibly show traces (console.trace, exceptions and error objects), and handle sourcemap. This led us to fix one last standing issue we had with them in the console (not using them for logged Error object), which is great because we now honor sourcemap everywhere, and people using build steps should have a better time working with our tools.
Getters are widely supported in browsers and heavily used in frameworks like vue.js for computed properties. When inspected in DevTools, getters reference their function, not the return value. This is because we can’t evaluate anything on your behalf, since it may cause side-effects on your page/app (for example if you’re modifying a state in the getter, or adding a class to a DOM element). But at least, we can provide a way for the user to invoke the getter in order to get the return value.
2019
Pheew, 2018 was quite a ride. I think we are now seeing the result of all of our 2016 & 2017 hard work, which makes us work on features more efficiently.
I also wanted to give a special thank to Victoria, Florens and Matt Croud. They helped us through the year, making design analysis and providing detailed mockups on complex problems. The console wouldn’t be the same without their terrific work.
As we start the new year, we already have 2 features in mind for the first half of the year.
The first one is grouping warning messages from the same category. We know some warnings can be verbose and clutter the console, making the user not pay attention to those. So we are going to identify those messages and group them, while trying to find a way for the user to be notified.
The second one is to revive the old-trusty Firebug Editor mode. Basically, we want the console input to feel more like a playground, with more room to play with it. The editor will probably be on the left side on the screen, with the output on the right, and won’t clear on execution so one can quickly iterate writing a code snippet.
There’s also other ideas floating around, like how to ease the communication with other tools (and more specifically the debugger), but nothing clear yet.
If you are thinking of a feature that might benefit the console users, please reach us on Twitter (@FirefoxDevTools).
Thanks for sticking with me on this lengthy post, and let’s all have a great 2019 year :)